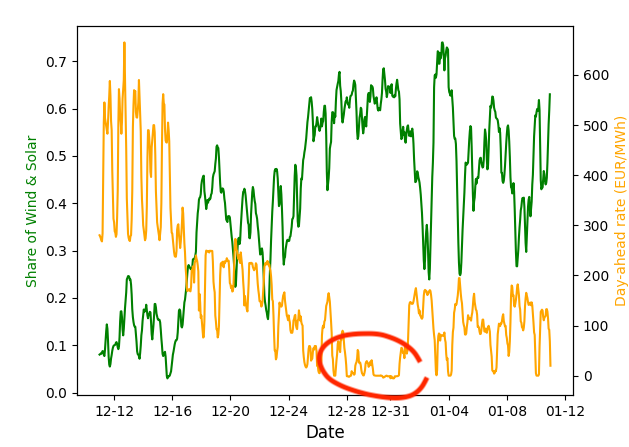
Taking for example the German grid (~ 60 GW load), the spot market prices now routinely "flat-line" at or below zero during nights and week-end on particularly blustery days. This forces wind farms to shut down (curtailment) during times when they would be at their most productive. Because the production potential of wind & solar is each highly synchronised across a relatively large geographic area, this trend will only increase as more wind and solar capacity is added to the same grid and profitably selling renewable energy "as-produced" will become increasingly difficulty.
For the next stages of integration into the grid, wind & solar resources might have to be combined with storage, moving away from delivering power whenever available and moving towards delivering whenever it is needed. An alternative strategy might be to deploy new resources in a more "contrarian" mode - for example high-alpine or vertical east-west oriented bi-facial solar plants that don't follow the summer mid-day peak.
Using the granular time-series data from the ENTSO-E open-data platform presented in the previous post, we can look at some of the pattern of wind and solar availability.
The following charts show the solar and on-shore wind forecasts for Germany, aggregated by hour of day over a 3 month period of 2002 for each of the 4 seasons:

We can see that for this particular part of northern, continental Europe, wind is generally stronger in the winter half of the year and due to the high latitude, solar is much stronger in the summer than in the winter. Wind also shows a much higher day-to-day variance than solar, but practically evens out in terms of average intra-day patterns, while solar energy product is concentrated more deterministically on a few hours around mid-day. When combining the two types of resources, we (unsurprisingly) see a lower volatility than for each of the two sources. Before starting the analysis, I would have expected a more pronounced pattern of wind distribution across hours of the day (e.g. more wind during the night, less during mid-day) as well as possibly stronger negative correlation (less wind on blue-sky & sunny days and vice versa.).
Another way to look at the mismatch between supply and demand is to determine what amount of storage would be needed to bridge the gap:
| Type | Avg Power (GW) | Total Energy (GWh) | Storage Capacity (GWh) | St. Power (GW) | St. Duration (h) | Capcity Ratio (%) | Stored Energy Ratio (%) |
|---|---|---|---|---|---|---|---|
| solar as base load | 6.4 | 55771.0 | 14156.6 | 31.7 | 447 | 25.38 | 60.87 |
| wind as base load | 11.3 | 99352.3 | 18382.9 | 29.7 | 620 | 18.5 | 33.82 |
| combined as base load | 17.7 | 155123.2 | 11826.1 | 42.1 | 281 | 7.62 | 28.0 |
| solar as 11.4% of load | 6.4 | 55771.0 | 15077.0 | 31.5 | 479 | 27.03 | 58.71 |
| wind as 20.3% of load | 11.3 | 99352.3 | 15680.7 | 29.4 | 533 | 15.78 | 32.76 |
| combined as 31.7% of load | 17.7 | 155123.2 | 9237.4 | 37.8 | 244 | 5.95 | 25.65 |
This ludicrously over-simplistic simulation assumes an idealised storage of 100% efficiency that would redistribute the variable rate wind & solar production into either a constant output corresponding to the yearly average ("base-load") or to a constant fraction of the actual load curve that corresponds to the yearly share of energy production. See for example this paper for a more realistic/sophisticated approach to storage impact simulation.
We can see that in general solar requires a higher rate of storage capacity than wind - about 28% of storage capacity per amount of energy produced and about 60% of the energy needs to be cycled through storage instead of used directly when produced.
Combining both sources significantly reduced the storage capacity needed, to about 6% of the energy produced and about 25% of the energy requiring storage.
This is still a daunting amount - equivalent to about 450 times the capacity of the new Nant de Drance pumped hydro power plant in Switzerland or the battery packs of 90M Tesla model S. Also the cycle efficiency of real storage systems are far from 100%. They range from 90% for batteries to about 70-80% for pumped hydro to less than 50% for P-to-X.
As we move into the next phase of large scale renewable energy deployment, storage technology will be the space to watch.