<- Part II: Data Collection
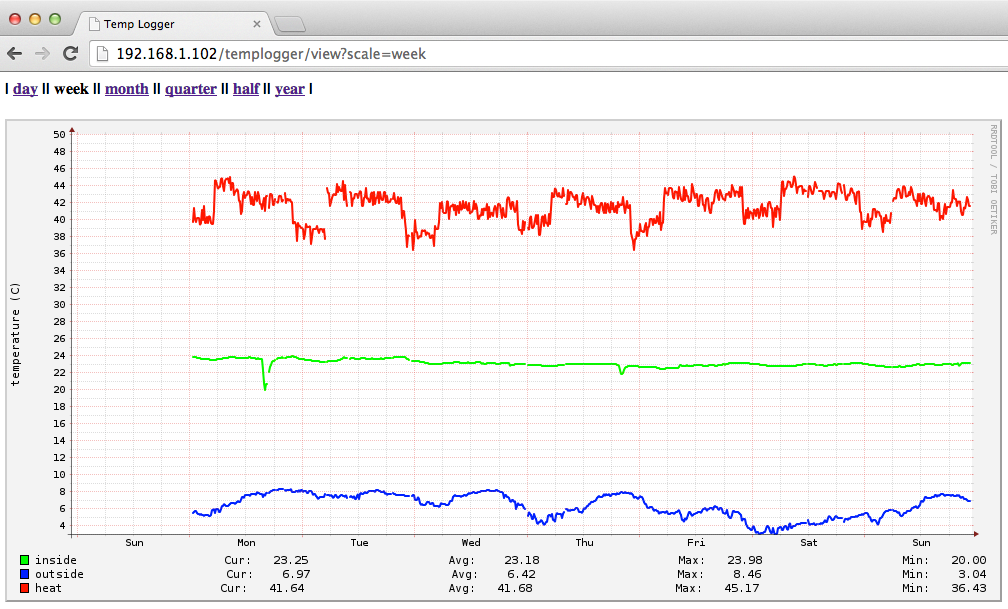
Once we have accumulated some data in the RRD database, we can start generating some plots with the RRDTools built-in graph function. The graph above shows the values of the DS18B20 temperature sensors over 3 unseasonably warm days in January. Because of the short cables, the sensors are not optimally placed. E.g. the inside temp sensor is relatively close to the radiator, the outside one is on the ledge, just outside the window and still behind a partially closed shutter in a narrow alley between 2 old poorly isolated buildings. According to the weather report, the current outside temperature is about 3-4 C less than what the sensor shows. From the chart, we can see that the heater feed temperature seems to fluctuate a bit, maybe a sign of hysteresis in the burner controller. The heater temperature is also lowered a bit for about 6h during each night, but this seems not to have any noticeable effect on the room temperature. There are small gaps in the graph, which are caused by read errors or other lapses in the data collection. The chart is generated by running the following command:
#!/bin/sh

rrdtool graph /var/www/temp_graph.png \
-w 1024 -h 400 -a PNG --slope-mode \
--start -3d --end now \
--vertical-label "temperature (°C)" \
DEF:in=data/templog.rrd:internal:AVERAGE \
DEF:out=data/templog.rrd:external:AVERAGE \
DEF:heat=data/templog.rrd:heat:AVERAGE \
LINE2:in#00ff00:"inside" \
LINE2:out#0000ff:"outside" \
LINE2:heat#ff0000:"heat"
A graph command roughly requires 3 types of parameters: general setup, data-source definitions and drawing commands. For more details, see the RRDTool graph documentation.
In order to view the graph on a computer, tablet or smartphone connected to the same wifi network, we can most easily export it through a web-server. Among the major web servers, lighttpd is probably the one with the smallest resource footprint. We can install it like this:
sudo apt-get install lighttpd
sudo touch /var/www/temp_graph.png
sudo chown pi:pi /var/www/temp_graph.png
We could simply regenerate the graph periodically with another cron job and be done with it or we could go ahead and build a small web application, which generates one or potentially several kinds of graphs on demand.
Among the many available frameworks which help simplify building web applications in python, we somewhat arbitrarily choose web.py for its simple URL routing and request/response management.
The following simple web-app handles 2 URL servlets - graph & view each supporting a scale parameter. While graph calls rrdtool graph to generate a PNG image, view generates a web page around it including a menu to toggle the scale parameter from a daily to a yearly granularity.
#!/usr/bin/python

import os
import rrdtool
import tempfile
import web

# web.py app URL routing setup
URLS = ('/graph.png', 'Graph',
        '/view', 'Page')

RRD_FILE = '/opt/templog/data/templog.rrd'
SCALES = ('day', 'week', 'month', 'quarter', 'half', 'year')
RESOLUTIONS = {'day': '-26hours', 'week':'-8d', 'month':'-35d', 'quarter':'-90d',
  'half':'-6months', 'year':'-1y'}

class Page:
    def GET(self):
        scale = web.input(scale='day').scale.lower()
        if scale not in SCALES:
            scale = SCALES[0]
        result = '<html><head><title>Temp Logger</title></head><h4>'
        for tag in SCALES:
            if tag == scale:
                result += '| %s |' % (tag,)
            else:
                result += '| <a href="./view?scale=%s">%s</a> |' % (tag, tag)
        result += '</h4>'
        result += '<img src="./graph.png?scale=%s">' % (scale, )
        result += '</html>'
        web.header('Content-Type', 'text/html')
        return result

class Graph:
  def GET(self):
      scale = web.input(scale='day').scale.lower()
      if scale not in SCALES:
          scale = SCALES[0]
      fd,path = tempfile.mkstemp('.png')
      rrdtool.graph(path,
                    '-w 900',  '-h',  '400', '-a', 'PNG',
                    '--slope-mode',
                    '--start',  ',%s' % (RESOLUTIONS[scale], ),
                    '--end', 'now',
                    '--vertical-label',  'temperature (C)',
                    'DEF:in=%s:internal:AVERAGE' % (RRD_FILE, ),
                    'DEF:out=%s:external:AVERAGE' % (RRD_FILE, ),
                    'DEF:heat=%s:heat:AVERAGE' % (RRD_FILE, ),
                    'LINE2:in#00ff00:inside ',
                    'GPRINT:in:LAST:Cur\:%8.2lf',
                    'GPRINT:in:AVERAGE:Avg\: %8.2lf',
                    'GPRINT:in:MAX:Max\:%8.2lf',
                    r'GPRINT:in:MIN:Min\:%8.2lf\j',
                    'LINE2:out#0000ff:outside',
                    'GPRINT:out:LAST:Cur\:%8.2lf',
                    'GPRINT:out:AVERAGE:Avg\:%8.2lf',
                    'GPRINT:out:MAX:Max\:%8.2lf',
                    r'GPRINT:out:MIN:Min\:%8.2lf\j',
                    'LINE2:heat#ff0000:heat  ',
                    'GPRINT:heat:LAST:Cur\:%8.2lf',
                    'GPRINT:heat:AVERAGE:Avg\:%8.2lf',
                    'GPRINT:heat:MAX:Max\:%8.2lf',
                    r'GPRINT:heat:MIN:Min\:%8.2lf\j')
      data = open(path, 'r').read()
      os.unlink(path)
      web.header('Content-Type', 'image/png')
      return data


if __name__ == "__main__":
    web.application(URLS, globals()).run()
Running this app directly as /opt/templog/python/app.py creates a web-server listening on port 8080 and two working URLs - /view and /graph.png
The local web-server is at least very useful for testing and we could launch it as a service from /etc/init.d . But since we already have lightthpd running, we can as well serve this app through it via the fastcgi support. For that we need to modify the config in /etc/lightthpd/lighttpd.conf by adding "mod_fastcgi" to server.modules and add the following section to the file:
fastcgi.server = ( "/templogger" =>
 (( "socket" => "/tmp/fastcgi.socket",
    "bin-path" => "/opt/templog/python/app.py",
    "check-local" => "disable",
    "max-procs" => 1
 ))
 )
After restarting the server with
sudo /etc/init.d/lighttpd restartWith this, we conclude the basic setup of a temperature monitoring system and any further ideas on what else could be done with this data is (for now) left as an exercise to the reader...

